Opensource BI / Dashboard / Reporting solutions?
-
@dave_c said in Opensource BI / Dashboard / Reporting solutions?:
Yes, I found weird to find Grafana as an suggestion for cross tab reports created by non-technical users.
Yeah, what I saw for grafana was mostly heatmap, uptime, system performance type metrics.
Rather than the types of BI graphs one would expect from a Accounting/Sales teams which would show profit, costs, etc.
-
I forgot to mention the other big option along with Jasper and Pentaho: Spago BI now known as Knowage
Edit: going back to school so I can learn to type.
-
@DustinB3403 said in Opensource BI / Dashboard / Reporting solutions?:
@dave_c said in Opensource BI / Dashboard / Reporting solutions?:
Yes, I found weird to find Grafana as an suggestion for cross tab reports created by non-technical users.
Yeah, what I saw for grafana was mostly heatmap, uptime, system performance type metrics.
Rather than the types of BI graphs one would expect from a Accounting/Sales teams which would show profit, costs, etc.
I'm not going to keep harping on it. You guys can come to whatever conclusion you want. I specifically mentioned for dashboards
Dashboards yes. You can do live reports with grafana within a certain time but a reporting tool might be better for reports specifically.
And here's a tool that specifically holds data so you can use Power BI and Grafana together. https://panoply.io/integrations/grafana/power-bi/
-
@stacksofplates I'm not trying to harp, I'm just trying to understand how/where grafana would make sense. PowerBI (as awful as it is) seems to sell the potential more towards the Accounting/Sales team where as grafana specifically (and the community with it) seems to focus on Infrastructure graphing.
I've not deployed either personally nor do I have a reason too, I also saw the panoply site but didn't dig into it.
-
@DustinB3403 said in Opensource BI / Dashboard / Reporting solutions?:
@stacksofplates I'm not trying to harp, I'm just trying to understand how/where grafana would make sense. PowerBI (as awful as it is) seems to sell the potential more towards the Accounting/Sales team where as grafana specifically (and the community with it) seems to focus on Infrastructure graphing.
I've not deployed either personally nor do I have a reason too, I also saw the panoply site but didn't dig into it.
Yeah I mean Grafana is just a reporting tool. It will report literally anything you put into it. It's kind of like saying Jenkins is only a build tool. It does soo much more but some people only look at it that way.
-
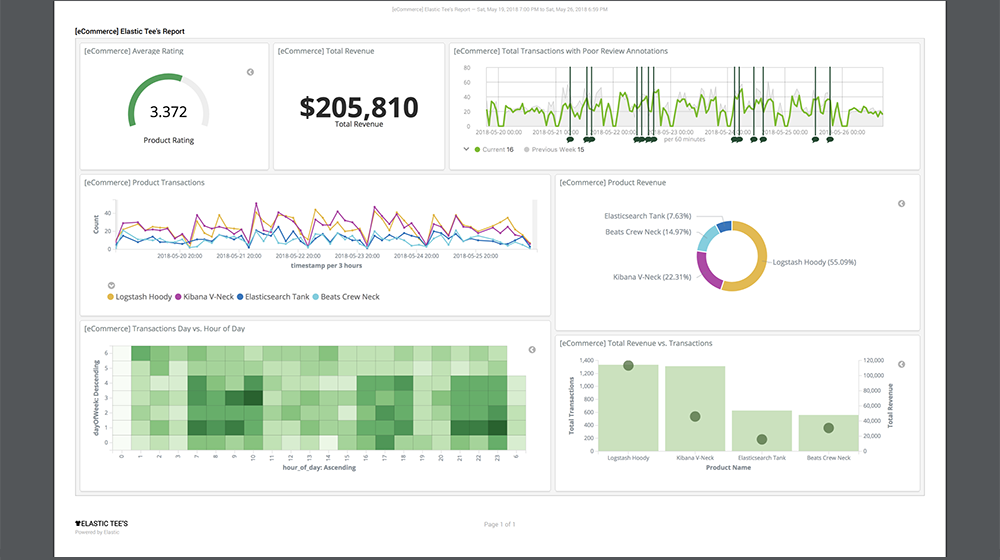
Obviously this is a stupid simple example, but I don't have any BI things to integrate with.

-
Here's another example in Kibana. You can pull the same data out and display in Grafana